Back to Top
Skip to main content
NETL Logo
NETL-ORD – Micro-XCT Characterization and Examination of Pressured Cores
Project Number
NETL-ORD
Last Reviewed Dated
Goal

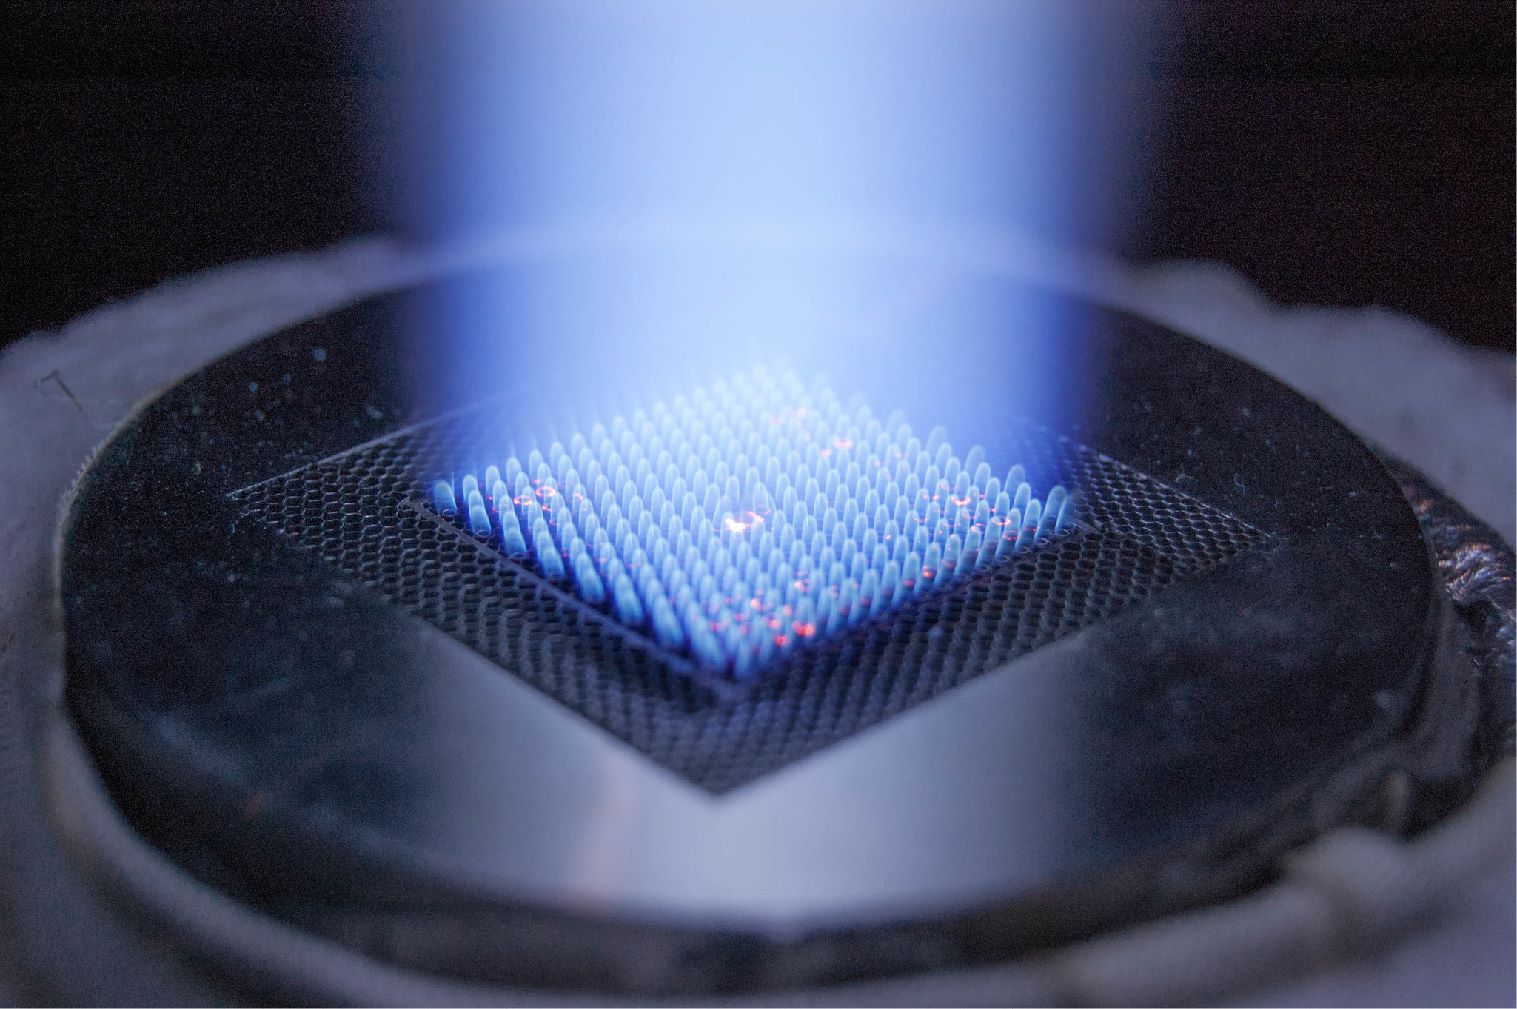
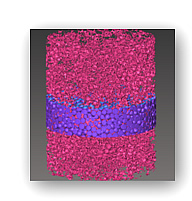
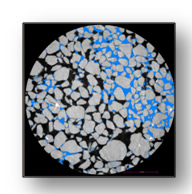
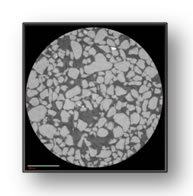
The primary goal of this research is to visualize gas hydrate within sediment pore spaces under in situ conditions using a high-resolution micro-XCT scanner.

Performer(s)

Yongkoo Seol – NETL Office of Research & Development
Eilis Rosenbaum – NETL Office of Research & Development
Jongho Cha- Oak Ridge Institute for Science and Education

Location
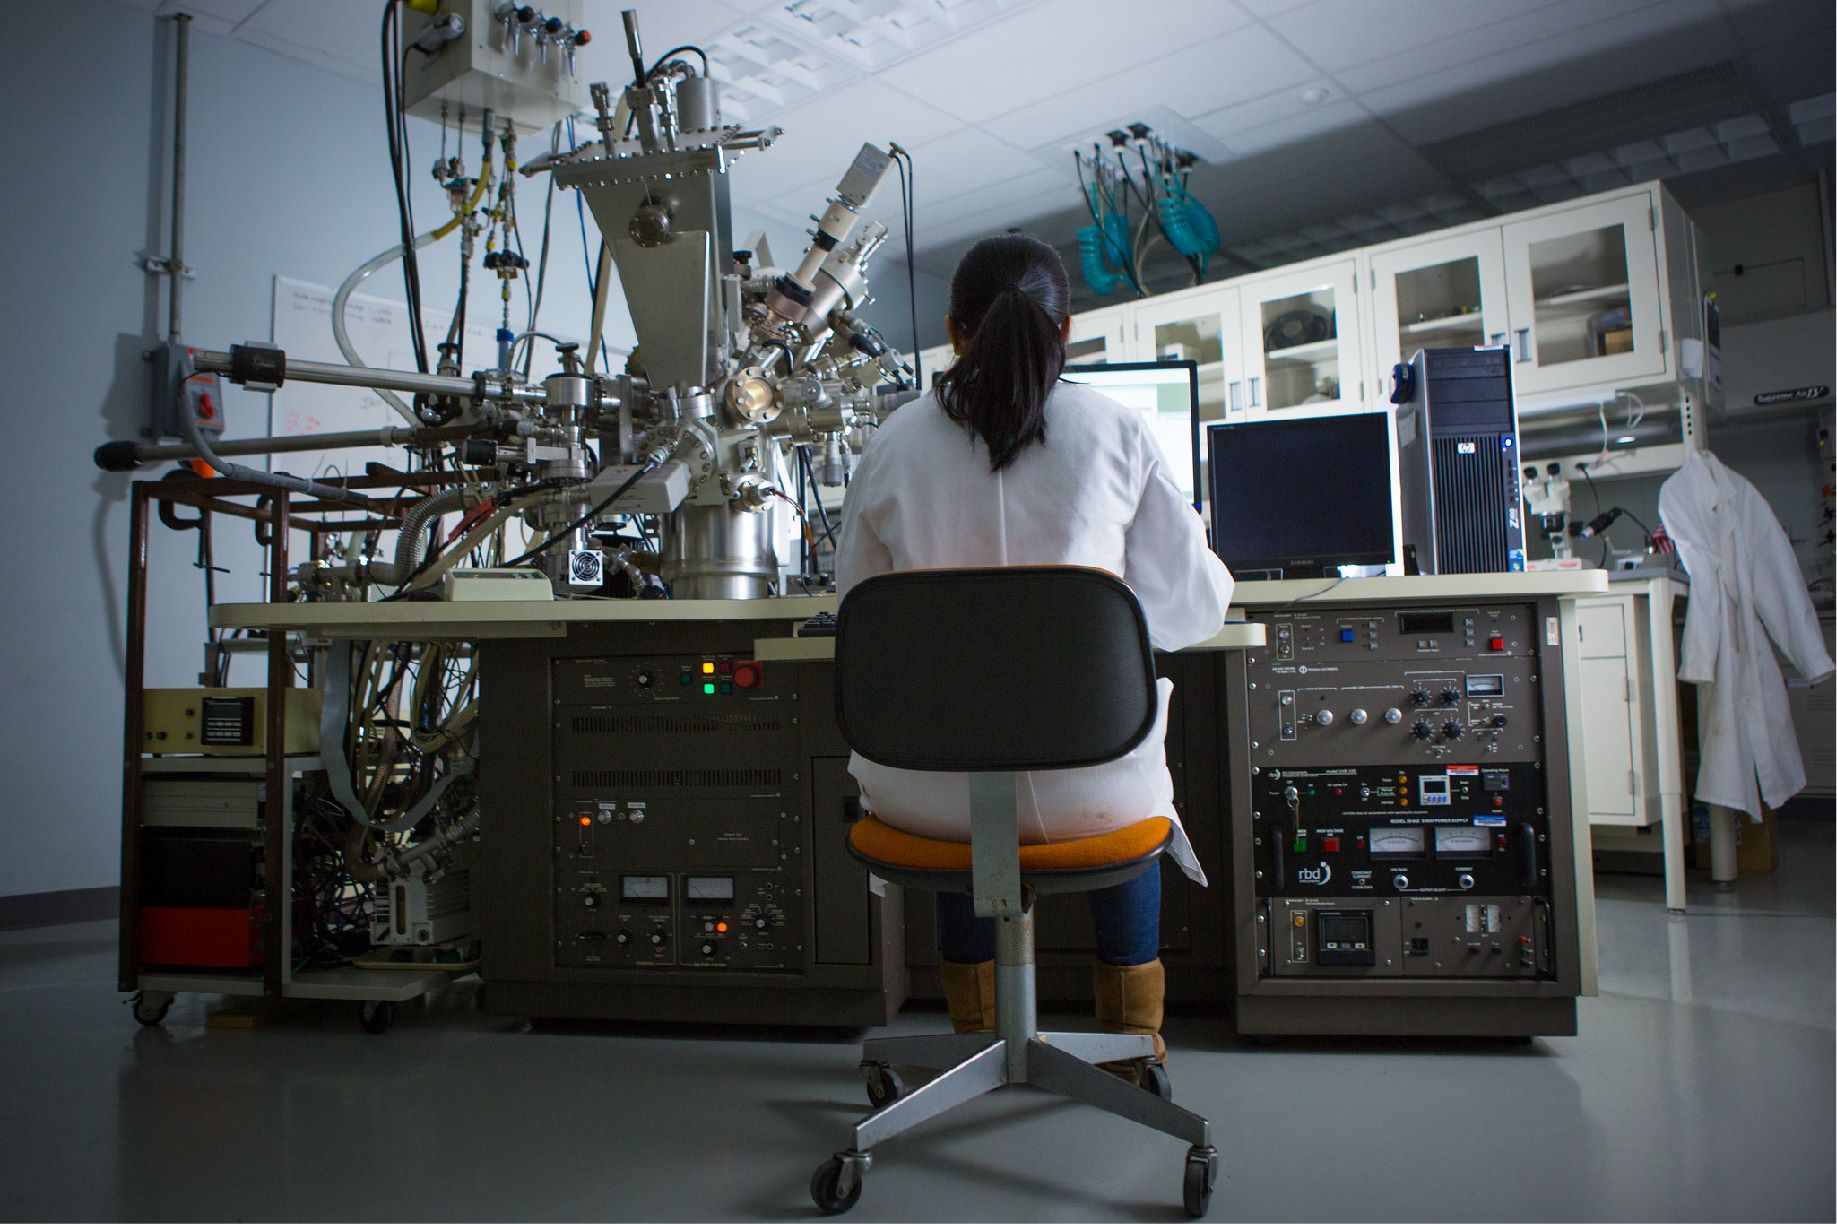
National Energy Technology Laboratory - Morgantown, West Virginia

Background

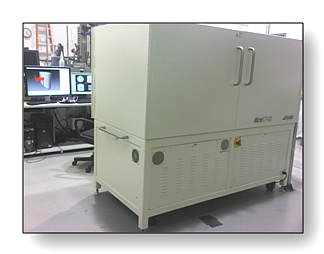
The initial phase of this research will focus on developing the experimental system needed to accommodate hydrate-bearing samples under in-situ conditions within an existing micro-XCT (X-ray transparent cell) system. Development will consist of designing, building, and testing the two main components needed to perform hydrate formation and dissociation experiments: (1) a micro-XCT compatible pressure vessel and (2) an experimental system providing controls on in situ pressure and temperature conditions, liquid /gas flow injection and collection, and data logging.

A pressure vessel that will hold a small (~1/4 inch diameter by 3 inch long) sample under in situ conditions will be developed to allow visualization of hydrate formation and dissociation experiments within the vessel using the micro-XCT. The experimental control system will provide and maintain the appropriate pressure and temperature required for hydrate stability as well as providing the capability to control injection into and flow out of the pressure vessel.

Preliminary testing of the system will be performed with analogues mimicking hydrate with a focus on image quality optimization. Following system testing, researchers will perform micro-XCT analysis on synthesized hydrate-bearing sediments to confirm the ability of the system to form hydrate and confirm 3-D visualization of hydrate accumulation within the pore space.

Specific activities will be focused around the following 3 areas:

  1. Pressure vessel and experimental system design and construction
    A pressure vessel will be prepared that includes the following elements: a top stainless steel end cap, a vessel body made of beryllium for best X-ray transparency, and a bottom connection for the micro-XCT scanner sample base. The vessel body will be designed to contain 1/4 inch diameter by 3 inch long samples. The vessel will be equipped with ports for fluid injection and pressure/temperature monitoring, and confining pressure capability. The vessel will be designed for pressures up to 5000 psi and temperatures from -10 to +25 C. The vessel design will be a collaborative effort between NETL researchers and the manufacturer of the micro-XCT scanner to ensure appropriate compatibility.
  2. System parameter optimization
    The X-ray CT system parameters (beam strength, filter, resolution, dimension of view-of-interest, etc.) will be optimized to obtain data on 3-D observations of hydrate within the sediment matrix at the pore scale that is of sufficient resolution to quantitatively analyze the hydrate/sediment sample. Researchers will establish calibration methods to determine the densities of the sample components and develop image processing techniques for identifying hydrates and their threshold properties.
  3. Visualization of synthesized hydrate during formation and dissociation
    Upon the completion of the experimental system/pressure vessel development and system parameter optimization, methane hydrate will be formed and dissociated in packed sediments. Micro-XCT scans will be performed to confirm the capability to visualize hydrate within the pore space during the hydrate formation and dissociation processes.
Figure 1. Micro-CT scanner (Xradia Micro-XCT-400) installed at NETL in Morgantown, WV
Figure 2. CT scanning image showing gas migration pathways (in red) through fine grain sediment core (in gray)


Impact

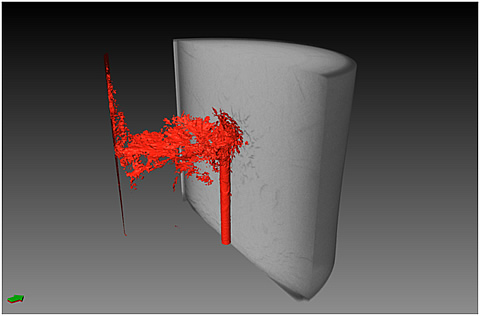
Real-time imaging of phase change and gas migration during hydrate formation and dissociation and subsequent numerical simulations supported by CT-based 3-D distribution maps will help provide insight into the impact of hydrate on gas migration, well bore stability, and sea floor hazards that could occur during development and production from hydrate reservoirs.

Accomplishments (most recent listed first)
  • Initial system testing has demonstrated the ability to visually identify a hydrate analog in the pore spaces of a sand medium.
  • Preliminary results indicate that, with image manipulation and appropriate density standards, the system can be used to differentiate between water and hydrate in pore spaces.
Figure 3. Threshold micro CT images: Left: Epoxy (pink) in the pore spaces of the glass beads (purple), Right: partially water-saturated sand packs showing water blobs in blue


Thresholded micro CT image: sand mixed with analogue plastics


Current Status

Quarterly research progress reports are posted below under "Additional Information".

DOE Contribution

FY2012: ~$120,000

Contact Information

NETL–ORD: Yongkoo Seol (Yongkoo.Seol@netl.doe.gov or 304-285-2029)

Additional Information

In addition to the information provided above, a listing of any available project related publications and presentations, as well as a listing of funded students, will be included in the Methane Hydrate Program Bibliography.

Quarterly Research Progress Report  [PDF-3.46MB] April - June, 2015

Quarterly Research Progress Report  [PDF-2.77MB] January - March, 2015

Quarterly Research Progress Report  [PDF-1.31MB]  October - December, 2014

Quarterly Research Progress Report  [PDF-3.01MB]  July - September, 2014

Quarterly Research Progress Report  [PDF-2.40MB]  April - June, 2014

Quarterly Research Progress Report  [PDF-2.62MB]  January - March, 2014