Back to Top
Skip to main content
NETL Logo
GIS and Web-Based Water Resource Geospatial Infrastructure for Oil Shale Development
Project Number
DE-NT0006554
Last Reviewed Dated
Goal

The goal of this project is to develop a GIS- (Geographic Information Systems) and web-based water resource geospatial infrastructure, which contains the basin baseline datasets for surface and groundwater, customized analytical toolsets, and user interfaces (UIs). The water resource geospatial infrastructure will provide water management solutions that will facilitate decision making, environmental impact studies (EIS), and cost estimation under different development scenarios for potential oil shale resource development in the Western U. S.

Performer(s)

Colorado School of Mines, Golden, CO 80401
The University of Oklahoma, Norman, OK 73019
Idaho National Laboratory, Idaho Falls, ID 83415-2107

Collaborators
USGS Energy Resources Program, Denver, CO 80228
Los Alamos National Laboratory, Los Alamos, NM 87545
USGS Colorado Water Science Center, Grand Junction, CO 81506

Background

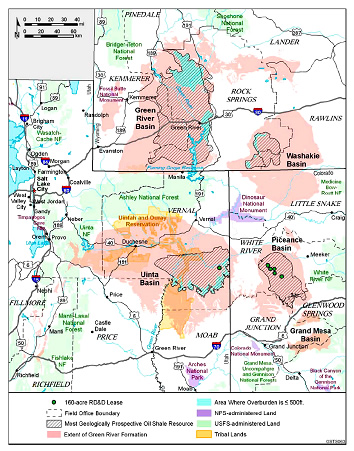
Abundant oil shale deposits are found throughout the midwestern and eastern United States; however, oil shale deposits in the Green River Formation in northwestern Colorado, southwestern Wyoming, and northeastern Utah are most likely to be developed because of their high oil content, accessibility, and extensive prior characterization.

The Green River oil shale deposits are located within the Upper Colorado River Basin, which includes the Colorado River and its tributaries north of Lee’s Ferry, Arizona. Colorado River waters are critical resources in this semi-arid region, being used for municipal purposes, irrigated agriculture, industry and mining, energy development, and for maintaining recreational, scenic, and ecological value. Oil shale development has diverse impacts on water quality and quantity that must be addressed when developing this resource.

Development of western oil shale resources will require significant quantities of water for mine and plant operations, reclamation, and associated economic growth. A Department of Energy (DOE) report indicates that current estimates (based on updated oil shale industry water budgets for new retorting methods) will be one-to-three barrels of water per barrel of produced oil. For an oil shale industry producing 2.5 million barrels of oil per day (MMBOPD), this equates to between 105 and 315 million gallons of water per day (MGD).

These numbers include water requirements for power generation, in situ heating processes, retorting, refining, reclamation, dust control, and on-site worker demands. According to the DOE fact sheet report, municipal and other water requirements related to population growth and industry development will call for an additional 58 MGD. In areas where oil shale is available, particularly in the Western U.S., the water will be drawn from local and regional sources. The major water sources would be rivers, which currently support the water demands from municipal, industrial, and agricultural activities in addition to baseline environmental flows.

Water quantity, as well as water quality, issues such as carbon dioxide (CO2) footprint and the possibility of oil spills due to the large amounts of shale oil produced, processed, and transported need to be addressed. Stream temperature could also be altered due to warm wastewater discharge from power plants, by consuming cool water, or by lowering the ground water table. Toxic trace elements and organic chemicals from stack emissions from processing operations, chemicals used in upgrading and gas processing, leachates from raw and retorted shale, and associated industrial and municipal wastes are also a concern because of their potential impact on aquatic life and human health via drinking water supplies and irrigation.

These potential environmental impacts necessitate further study of water usage issues related to shale oil development. A basin-integrated baseline for surface and ground water data is the foundation of these studies. The study of water availability and environmental impact is a critical early step for the potential development of oil shale resources in the Western U.S.

Green River Formation basins in Colorado, Utah, and Wyoming. Figure shows most geologically prospective oil shale resources; areas where the overburden above the oil shale resources is =500 ft; and locations of the six RD&D projects.


Impact

One of the greatest challenges to advancing scientific discovery and industrial development is to efficiently collect and share data with the scientific community and general public. The development of a water resource geospatial database will create a repository for large volumes of water resource and oil shale data. This database will allow for collaborative regional basin assessments for future oil shale development. This type of collaboration provides the ideal atmosphere for the development of new, generically useful approaches for the use of technology and procedures that promote the best and most widespread use of our vast data holdings despite their disparate locations and heterogeneous formats. The database will enhance and standardize existing oil shale data by developing tools and graphical user interfaces (GUIs) to integrate previously dispersed and diverse datasets. The results of this research will provide a powerful tool to facilitate communication among industry, state, and federal regulators, and other stakeholders.

Accomplishments (most recent listed first)
  • A relational geodatabase, including all of the data collected, such as surface water, groundwater, geological, geomorphologic, oil shale (Fisher assays), surface water, and climate data sets.
  • Automated data processing scripts (Matlab) for database link with surface water and Geological Model
  • ArcGIS Model for Hydrogeologic Data processing for Groundwater Model Input.
  • Final models including the 3-D geological model, surface water/groundwater modeling, energy resource development systems modeling.
  • Web-based geo-spatial infrastructure for data exploration, visualization, and dissemination.
  • Completed the digitizing selected legacy data from paper maps for analysis and storage in the database.
  • Implemented digital images into ArcGIS and georeferenced to real-world coordinates to overlay on other real-world datasets.
  • A georeferenced and digitized surface expression of faults in the Piceance Basin was developed. The faults play a critical role in water movement throughout the basin by providing preferential conduits for both recharge and discharge of groundwater. The faults will be an important component of the 3-D geologic model and geo-hydrologic conceptual model.
  • Georeferenced and digitized surficial alluvial deposits that make up the stream valleys in the Piceance Basin were added to the database. It is important to define the extent and volume of the surficial alluvial aquifers in the Piceance Basin system. Alluvial valleys are in direct contact with the shallow groundwater table and surface water. Quantifying the storage capacity of the alluvial aquifers is an important step in characterizing available water sources and potential shallow groundwater injection storage opportunities.
  • Feature classes of hydrogeologic units previously compiled from USGS publications (Taylor, 1982) were renamed in the geodatabase to be consistent with the nomenclature of the original publication, and to allow for correlation to nomenclature used in the MODFLOW groundwater model, which is currently being developed.
  • An Adobe Flex 2.2 API development environment was established for ArcGIS Server on the project server, and an initial test mapping site of the web-based GIS was developed.
  • All project products were migrated from ArcGIS Desktop version 9.3 to version 10.0.
  • WARMF surface water modeling has been completed.
  • As part of the technology transfer effort for this project:
    • Presentations at the International Petroleum Environmental Conference (IPEC), Ground Water Protection Council (GWPC), the 2010 Rocky Mountain Energy Epicenter Conference (RMEEC), the 2010 Association of Environmental and Engineering Geologists (AEG) Annual Meeting, and the 30th Oil Shale Symposium (30th OSS) were given in 2010. The PI served as session chair/co-chair for three (RMEEC, AEG, and OSS) of these conferences.
    • The beta version of the geodatabase prototype was delivered to NETL’s Sugarland Office on June 30, 2011. A presentation/demonstration of the project deliverables was given on the same day.
    • A presentation was given at the Association of Environmental and Engineering Geologists (AEG) 2011 Annual Meeting in Anchorage, Alaska, September 19–24, 2011.
    • Two presentations were given at the 31st Oil Shale Symposium in Golden, Colorado, October 17–21, 2011.
    • A presentation on the project and the process simulation model was given at the Rocky Mountain Regional office (in Broomfield, CO) of the Environmental Systems Research Institute (ESRI) on Thursday, March 8, 2012. The spatial process simulation and resulting web-based GIS interface is new and innovative and has drawn the attention of the regional ESRI office.
  • Updated USGS Piceance Basin Fisher assays (the updated 2010 version) and Geologic Tops data were integrated into the geospatial infrastructure.
  • A VolumeCalculation Tool designed to calculate the volume of geologic zones by computing the difference between a user-specified top zone and bottom zone was developed.
  • A ComputeMultipatch Tool was designed and developed to build vector-based multipatch feature classes that represent geologic volumes.
  • A ComputeRasterSurfaces Tool designed to compute raster surfaces for the top of geologic zones based on borehole x, y, z input or from contour input was developed.
  • The framework/prototype of the integrated geodatabases, including all of the data collected thus far (surface water, groundwater, geological, geomorphologic, oil shale (Fisher assays), and climatic data sets), was completed.
  • A Dell R710 GIS server was purchased and configured. This GIS server serves as the host for data storage and web-based GIS.
  • A geologic retort model and creation of input parameters for further development of the dynamic systems retort model at INL.
  • A MatLab script that post-processes the surface water WARMF model scenario into an ArcGIS format.
  • The web mapping application has deployed mapping services to the World Wide Web.
  • Base code in the Flex environment to implement further functionality in the web site. A newer version (V3) of the interactive web-mapping site.
  • A new version (version 4) of the geodatabase, including specific tables in association with a retort grid that will serve as input data for the dynamic systems model, is being developed.
  • An interactive web-based water resources model for the Piceance Basin was started.
  • A revised framework of groundwater MODFLOW model was constructed from the project geodatabase and patterned after the Taylor (1982) model.
  • Established a conceptual model of the Process Simulation model.
  • Constructed a conceptual web-based GIS for displaying the simulation output.
3D Geological Model - Visualization of the Oil content in Gallons per Ton from the Fisher assays measurements in MVS (Mining Visualization System) with the top surface defined by a 10 meter DEM (Digital Elevation Model)

Key Findings

  • Spatial and temporal water distribution is highly variable in the Piceance Basin.
  • Surface water is limited within the Piceance basin, with largest Q being Parachute and Roan Creek at ~20,000 acre-ft./yr. and ~30, 000 acre-ft./yr., respectively
  • Basin wide groundwater recharge is ~39,422 acre-ft./yr., balanced by spring Q and base flow of ~18,862 and 20,791 acre-ft./yr., respectively. Part of this flow could be utilized by storing flow during spring runoff and peak flow events.
  • The versatile system dynamic modeling reveals that water consumption is not linearly related to oil shale production.
  • Site construction and oil shale production have an overall water production, and site remediation is the major water consumption phase.

Expected Impacts

  • The geodatabase provides “baseline” data for further study of oil shale development and identification of further data collection needs.
  • The 3-D geological model provides a better understanding of the Piceance Basin structure spatial distribution of the oil shale resources through data interpolation and visualization techniques.
  • Project research will help to quantify water shortage and provide a better understanding of the spatial distribution of the available water resources.
  • Research revealed the phase shift of water usage and oil shale production, which will facilitate better planning for oil shale development.
Current Status

The project has ended. The final report is available below under "Additional Information".

Project Start
Project End
DOE Contribution

$883,971

Performer Contribution

$298,253

Contact Information

NETL – William Fincham (William.Fincham@netl.doe.gov or 304-285-4268)
Colorado School of Mines – Wei (Wendy) Zhou (wzhou@mines.edu or 303-384-2181)

Additional Information

Final Project Report [PDF-14.6MB]

Technology Status Assessment [PDF-44KB]

Publications

The Office of Technology Assessment Materials Program staff, An Assessment of Oil Shale Technology, Volume I, June 1980

Geology and Resources of Some World Oil-Shale Deposits (USGS Scientific Investigations Report 2005–5294)

Draft OSTS PEIS, Appendix A: Oil Shale Development Background and Technology Overview (De¬cember 2007)

U.S. Department of Energy, National Energy Technology Laboratory 2007 Oil Shale Environmental Issues and Needs Workshop, October 18, 2007, Colorado School of Mines, Golden, Colorado, March 2008.

Zhou, W.; Chen, G.; Li, H.; Luo, H.; Huang, S. L., GIS Application in Mineral Resource Analysis – A Case Study of Offshore Marine Placer Gold at Nome, Alaska, Computers and Geosciences, 33 (2007), pp. 773–788.